- 标签
- 热门文章
- 推荐文章
Redis缓存测试全攻略从原理到实践
在电商等高并发场景下,商品详情页等热点数据的访问频率极高。直接频繁查询数据库将成为系统瓶颈。引入Redis作为缓存层是提升性能、保障稳定性的关键策略。然而,不正确的缓存使用会引入数据不一致、缓存穿透、雪崩等问题。因此,一套完整的缓存测试体系至关重要。
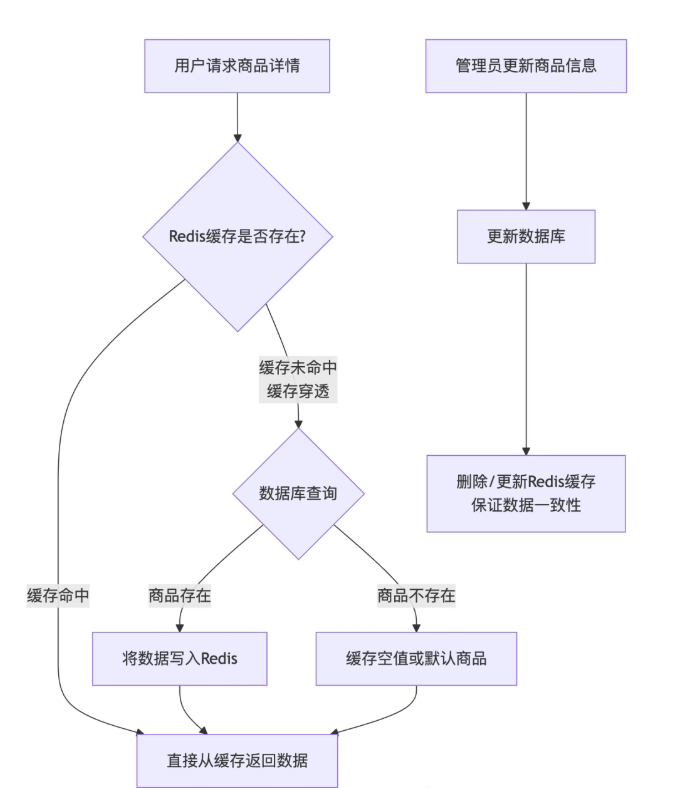
一、 核心业务流程与缓存原理
为了清晰地理解测试点,我们首先通过下图展示一次商品信息请求的完整流程,它涵盖了正常访问、缓存失效以及数据更新等关键场景:
二、 测试策略详解
1. 缓存命中测试
目的
验证缓存生效时,系统能正确返回缓存数据,减轻数据库压力。
技术方案
脚本
使用JMeter编写脚本,循环请求一批已知存在的商品ID。
断言
在响应头或Body中添加一个标记(如 "dataSource": "redis")来验证数据来源。
对比启用缓存前后的接口平均响应时间,应有显著下降。
监控
通过Redis的 INFO stats 命令监控 keyspace_hits 和 keyspace_misses,计算命中率。
2. 缓存更新测试
目的
保证数据源变更后,用户能及时看到最新数据,防止脏读。
技术方案
数据变更:通过自动化脚本或后台更新商品信息。
验证
主动更新策略(推荐)
如图1所示,更新DB后立即删除/更新缓存。测试时,更新后立即查询,验证返回的是新数据,且缓存已被更新。
过期策略
设置合理的TTL。测试时,更新DB后等待缓存自动过期,验证过期后第一次请求是否从DB加载新数据。
并发更新
模拟高并发场景下同时更新商品和查询商品,检查是否因并发操作导致脏数据。例如,在缓存失效的瞬间,大量请求穿透到DB,可能导致缓存被重复写入多次(可用锁缓解)。
3. 缓存穿透测试
目的
防止大量请求不存在的数据(如无效商品ID),绕过缓存直接冲击数据库。
技术方案
脚本
使用JMeter构造大量随机、不存在的商品ID进行请求。
防护措施验证
缓存空值
检查系统是否将查询为空的商品ID也缓存起来(设置较短的TTL), 后续相同非法请求会直接返回空。
布隆过滤器
在查询缓存前,先经过布隆过滤器判断商品ID是否存在。测试时,发送大量非法ID,断言其被快速拦截并返回错误信息(如"商品不存在")。
监控
在测试过程中,监控数据库的QPS,确认其没有异常飙升。
4. 缓存雪崩测试
目的
模拟大量缓存在同一时间点失效的场景,测试系统的容灾能力。
技术方案
失效模拟
编写脚本,批量执行 Redis-cli -h your_host -p your_port DEL key1 key2 ... 或等待一批设置相同TTL的缓存同时过期。
系统应对验证
缓存击穿
模拟某个热点Key在失效的瞬间,大量请求同时涌入数据库。测试系统是否使用互斥锁(Mutex Lock)或“逻辑过期”方案,只允许一个请求去重建缓存,其他请求等待。
熔断与限流
监控系统在数据库压力激增时,是否触发熔断机制(如直接返回默认页面),或使用限流(如令牌桶)保护DB。
二级缓存
检查是否启用本地缓存(如Caffeine)作为二级缓存,在Redis崩溃时提供基本服务能力。
缓存预热与更新策略
验证是否有后台服务在缓存大规模失效前,对热点数据进行异步预热。
5. 监控与日志分析
工具
Prometheus + Grafana
监控Redis的内存使用、连接数、命中率、网络IO等关键指标。
ELK Stack
收集应用日志,分析缓存操作错误、慢查询、锁竞争等问题。
三、 代码优化与分析
了解缓存命中率的当前值是非常有用的,但更重要的是能够跟踪缓存命中率的变化,以便进行性能优化和故障排查,我们可以通过定期查询缓存命中率,并将结果保存下来,然后使用这些数据生成缓存命中率的变化图表。下面是一个使用redis-py以及Redis的Python客户端redis-py来查询缓存命中率的示例代码:
import redis
import time
import logging
import matplotlib.pyplot as plt
import pandas as pd
from datetime import datetime
from typing import Optional, List
import numpy as np
# 配置日志
logging.basicConfig(level=logging.INFO, format='%(asctime)s - %(levelname)s - %(message)s')
logger = logging.getLogger(__name__)
class RedisHitRateMonitor:
def __init__(self, host: str = 'localhost', port: int = 6379, password: str = None, decode_responses: bool = True):
"""
初始化Redis连接池
使用连接池可以避免每次操作都建立和断开连接的开销。
"""
try:
self.redis_pool = redis.ConnectionPool(
host=host, port=port, password=password,
decode_responses=decode_responses, max_connections=10
)
self.r = redis.Redis(connection_pool=self.redis_pool)
# 测试连接
self.r.ping()
logger.info("Redis连接成功")
except redis.exceptions.ConnectionError as e:
logger.error(f"Redis连接失败: {e}")
raise
def get_hit_rate(self) -> Optional[float]:
"""
获取当前的缓存命中率
Returns:
float: 命中率 (0.0 - 1.0),如果出错返回None。
"""
try:
info = self.r.info('stats') # 只获取stats部分,效率更高
hits = info.get('keyspace_hits', 0)
misses = info.get('keyspace_misses', 0)
total = hits + misses
if total == 0:
logger.warning("当前无 keyspace 命令统计信息,命中率无法计算。")
return 0.0
hit_rate = hits / total
current_time = datetime.now().strftime('%H:%M:%S')
logger.info(f"[{current_time}] 缓存命中率: {hit_rate:.2%} (Hits: {hits}, Misses: {misses})")
return hit_rate
except redis.RedisError as e:
logger.error(f"查询Redis命中率时发生错误: {e}")
return None
def monitor_hit_rate_over_time(self, interval: int = 10, duration: int = 300) -> List[dict]:
"""
在一段时间内监控命中率的变化
Args:
interval: 采样间隔(秒)
duration: 总监控时长(秒)
Returns:
list: 包含时间戳和命中率的字典列表
"""
hit_rate_data = []
end_time = time.time() + duration
sample_count = duration // interval
logger.info(f"开始监控缓存命中率,持续 {duration} 秒,每 {interval} 秒采样一次,预计采集 {sample_count} 个样本...")
sample_index = 0
while time.time() < end_time:
sample_index += 1
current_time = datetime.now()
timestamp = current_time.strftime('%H:%M:%S')
rate = self.get_hit_rate()
if rate is not None:
data_point = {
'timestamp': timestamp,
'datetime': current_time,
'hit_rate': rate,
'sample_index': sample_index
}
hit_rate_data.append(data_point)
logger.info(f"采样进度: {sample_index}/{sample_count}")
# 动态计算睡眠时间,确保精确的采样间隔
sleep_time = interval - (time.time() % interval)
time.sleep(sleep_time)
logger.info(f"监控结束,共采集 {len(hit_rate_data)} 个有效样本。")
return hit_rate_data
def plot_hit_rate_trend(self, hit_rate_data: List[dict], save_path: Optional[str] = None):
"""
绘制命中率趋势图
Args:
hit_rate_data: 监控数据
save_path: 图片保存路径,如果为None则显示图片
"""
if not hit_rate_data:
logger.error("没有数据可绘制图表")
return
# 准备数据
timestamps = [data['timestamp'] for data in hit_rate_data]
hit_rates = [data['hit_rate'] for data in hit_rate_data]
sample_indices = [data['sample_index'] for data in hit_rate_data]
# 创建图表
plt.style.use('seaborn-v0_8')
fig, (ax1, ax2) = plt.subplots(2, 1, figsize=(12, 8))
# 绘制趋势线图
ax1.plot(sample_indices, hit_rates, 'b-', linewidth=2, marker='o', markersize=4, label='命中率')
ax1.set_xlabel('采样点')
ax1.set_ylabel('命中率')
ax1.set_title('Redis缓存命中率趋势图', fontsize=14, fontweight='bold')
ax1.grid(True, alpha=0.3)
ax1.legend()
# 设置Y轴为百分比格式
ax1.yaxis.set_major_formatter(plt.FuncFormatter(lambda y, _: '{:.0%}'.format(y)))
# 在图上标注统计信息
avg_hit_rate = np.mean(hit_rates)
max_hit_rate = np.max(hit_rates)
min_hit_rate = np.min(hit_rates)
ax1.axhline(y=avg_hit_rate, color='r', linestyle='--', alpha=0.8, label=f'平均命中率: {avg_hit_rate:.2%}')
ax1.legend()
# 添加统计信息文本框
stats_text = f'''统计信息:
平均命中率: {avg_hit_rate:.2%}
最高命中率: {max_hit_rate:.2%}
最低命中率: {min_hit_rate:.2%}
样本数量: {len(hit_rate_data)}'''
ax1.text(0.02, 0.98, stats_text, transform=ax1.transAxes, verticalalignment='top',
bbox=dict(boxstyle='round', facecolor='wheat', alpha=0.8), fontsize=10)
# 绘制柱状图
bars = ax2.bar(range(len(hit_rates)), hit_rates, alpha=0.7, color='skyblue', edgecolor='navy')
ax2.set_xlabel('采样点')
ax2.set_ylabel('命中率')
ax2.set_title('缓存命中率分布', fontsize=12)
ax2.grid(True, alpha=0.3)
ax2.yaxis.set_major_formatter(plt.FuncFormatter(lambda y, _: '{:.0%}'.format(y)))
# 在柱状图上添加数值标签
for bar, rate in zip(bars, hit_rates):
height = bar.get_height()
ax2.text(bar.get_x() + bar.get_width()/2., height,
f'{rate:.1%}', ha='center', va='bottom', fontsize=8, rotation=45)
plt.tight_layout()
if save_path:
plt.savefig(save_path, dpi=300, bbox_inches='tight')
logger.info(f"图表已保存至: {save_path}")
else:
plt.show()
def generate_hit_rate_report(self, hit_rate_data: List[dict]):
"""
生成详细的命中率分析报告
"""
if not hit_rate_data:
logger.error("没有数据可生成报告")
return
hit_rates = [data['hit_rate'] for data in hit_rate_data]
report = {
'监控时长(分钟)': len(hit_rate_data),
'平均命中率': f"{np.mean(hit_rates):.2%}",
'最高命中率': f"{np.max(hit_rates):.2%}",
'最低命中率': f"{np.min(hit_rates):.2%}",
'命中率标准差': f"{np.std(hit_rates):.3f}",
'数据稳定性': "稳定" if np.std(hit_rates) < 0.1 else "波动较大"
}
print(" " + "="*50)
print("Redis缓存命中率分析报告")
print("="*50)
for key, value in report.items():
print(f"{key:.<20}: {value}")
print("="*50)
# 使用示例
if __name__ == "__main__":
try:
# 初始化监控器
monitor = RedisHitRateMonitor(host='localhost', port=8090)
# 获取一次命中率
current_rate = monitor.get_hit_rate()
# 监控5分钟,每30秒采样一次
hit_rate_data = monitor.monitor_hit_rate_over_time(interval=30, duration=300)
# 生成分析报告
monitor.generate_hit_rate_report(hit_rate_data)
# 绘制图表并保存
monitor.plot_hit_rate_trend(
hit_rate_data,
save_path=f'redis_hit_rate_{datetime.now().strftime("%Y%m%d_%H%M%S")}.png'
)
except Exception as e:
logger.error(f"程序执行失败: {e}")
下一条:gurobi求解器代理


 沪公网安备31011302006932号